- Printed Journal
- Indexed Journal
- Refereed Journal
- Peer Reviewed Journal
P-ISSN: 2394-0530, E-ISSN: 2320-3862


2015, Vol. 3, Issue 2, Part B
Cytotoxic effects of alcoholic extracts of 5 medicinal plants on mitosis in Allium cepa root tips after 12 h recovery from 24 h treatments
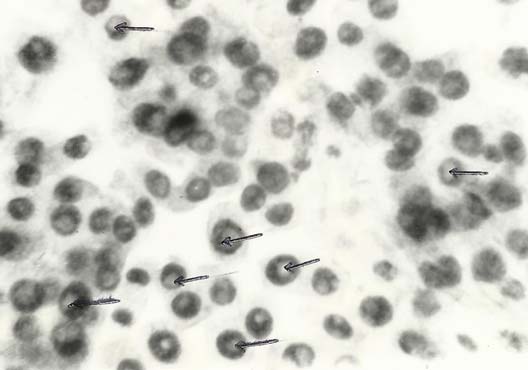
Fig.: Nuclear lesions (arrowed) in interphase cells of onion root tips treated with concentration of 75 mg-ml of the extract of G. africanum.
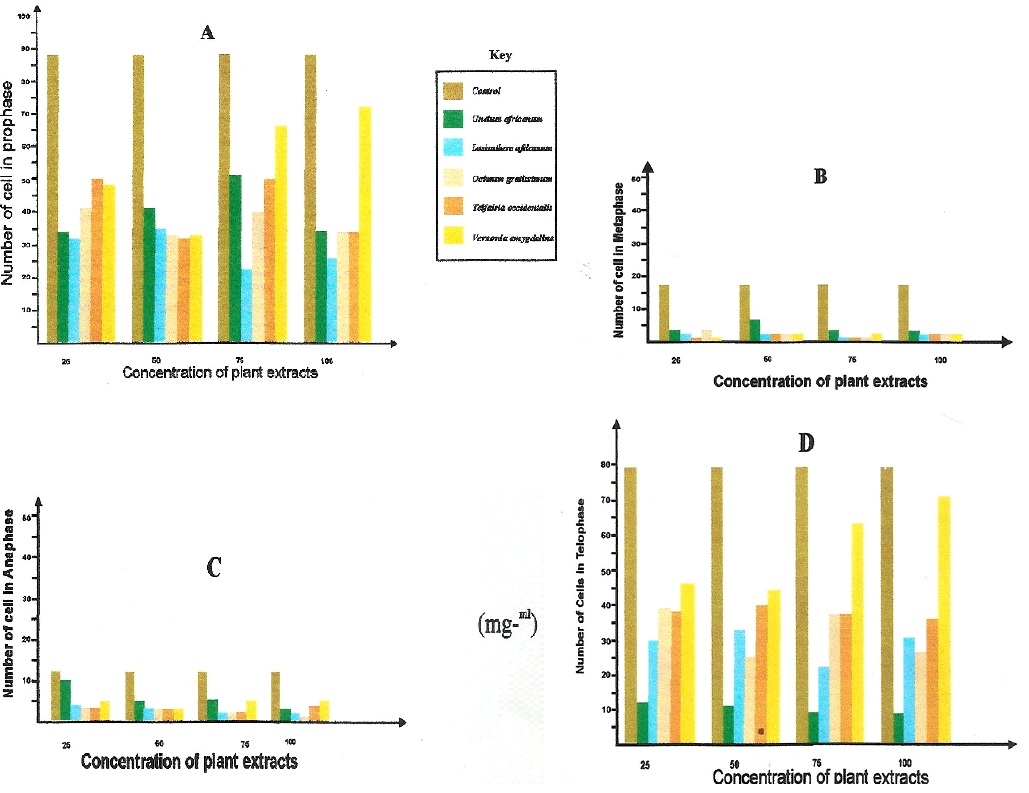
Fig.: Bar charts of the mean number of cells at the different stages of mitosis in the various concentrations of the plant extracts after 24 hr treatment and 12 hr recovery in distilled water of A. cepa root tips: A. Prophase; B. Metaphase; C. Anaphase; D. Telophase
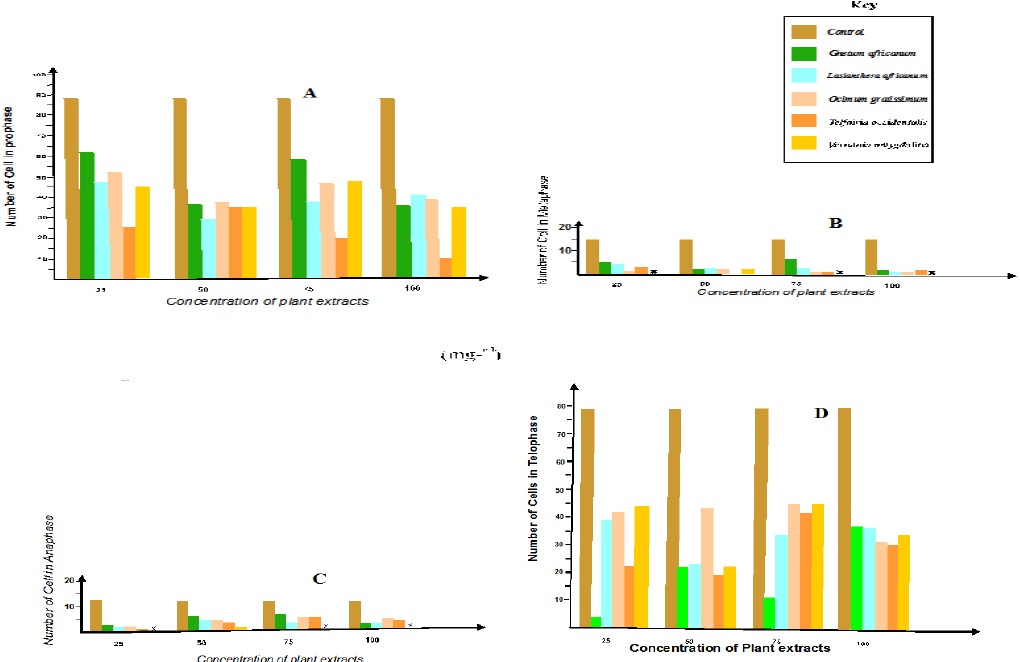
Fig.: Bar charts of the mean number of cells at the different stages of mitosis in the various concentrations of the plant extracts after 24 hr treatment of A. cepa root tips: A. Prophase; B. Metaphase; C. Anaphase; D. Telophase
Related Journal Subscription
Important Publications Links

Journal of Medicinal Plants Studies

- Home
- About Us
- Editorial Board
- Archives
- Instructions
- Article Submission
- Publish Book (ISBN)
- Contact Us
- Helpline No.: +91-9711224068
- Fast Publication: +91-7048922346