- Printed Journal
- Indexed Journal
- Refereed Journal
- Peer Reviewed Journal
P-ISSN: 2394-0530, E-ISSN: 2320-3862


2013, Vol. 1, Issue 3, Part A
Salt Effects on Growth and Leaf Chemical Constituents ofrnSimmondsia chinensis (Link) Schneider
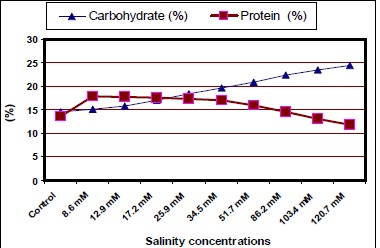
Fig.: Leaf content of carbohydrates of jojoba as affected by different salinity treatments
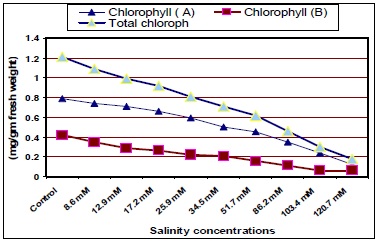
Fig.: Leaf content of chlorophyll of jojoba leaves as Affected by Different Salinity Treatments
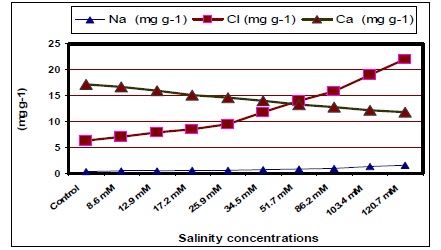
Fig.: Leaf mineral content (Na, Cl and Ca) in jojoba leaves as affected by different salinity treatments
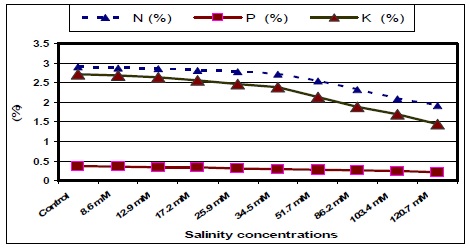
Fig.: Leaf mineral content (N, P and K) in jojoba leaves as affected by Different Salinity Treatments
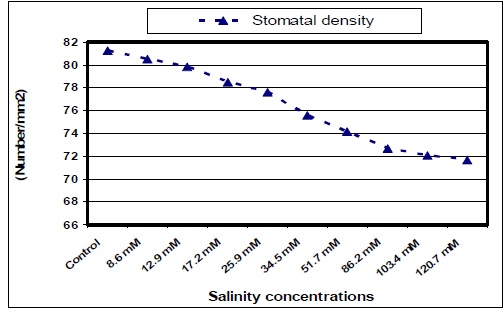
Fig.: Stomatal density of jojoba leaves as affected by different salinity treatments
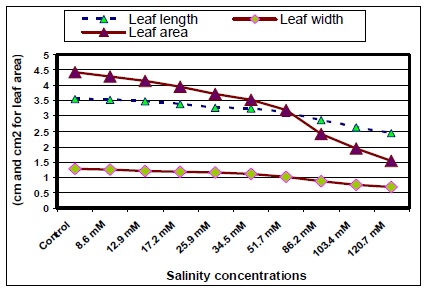
Fig.: Leaf length, width and its area of jojoba as affected by different salinity treatments
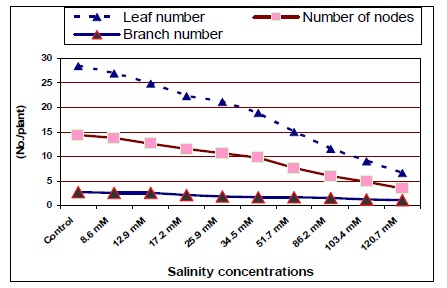
Fig.: Branch number, leaf number and number of nodes/plant of jojoba as affected by different salinity treatments
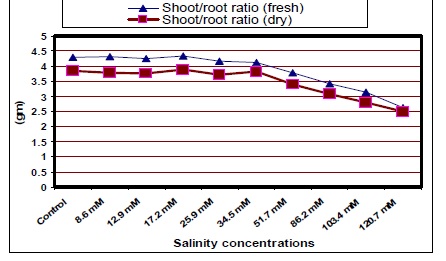
Fig.: Shoot/root Ratio (fresh & dry) of jojoba as Affected by Different Salinity Treatments
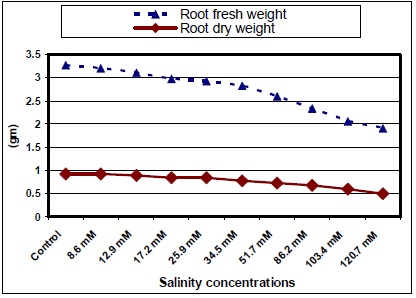
Fig.: Root Weight (fresh & dry) of jojoba Plants as Affected By Salinity Treatments.
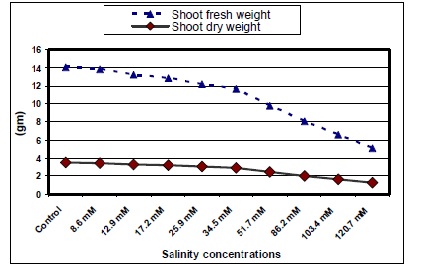
Fig.: Shoot weight (fresh & dry) of jojoba as Affected by Different Salinity Treatments
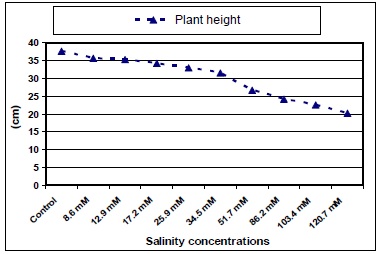
Fig.: Plant Height of jojoba as Affected by Different Salinity Treatments
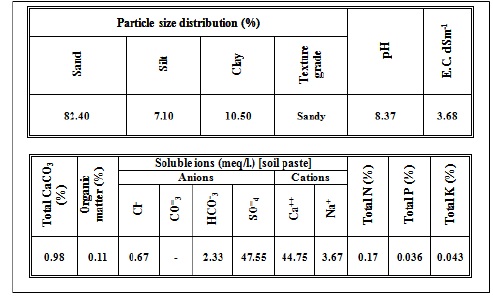
Fig.: Physical and chemical properties of used soil
Related Journal Subscription
Important Publications Links

Journal of Medicinal Plants Studies

- Home
- About Us
- Editorial Board
- Archives
- Instructions
- Article Submission
- Publish Book (ISBN)
- Contact Us
- Helpline No.: +91-9711224068
- Fast Publication: +91-7048922346