- Printed Journal
- Indexed Journal
- Refereed Journal
- Peer Reviewed Journal
P-ISSN: 2394-0530, E-ISSN: 2320-3862


2014, Vol. 2, Issue 5, Part A
Flag leaf characteristics and relationship with grain yield and grain protein percentage for three cereals
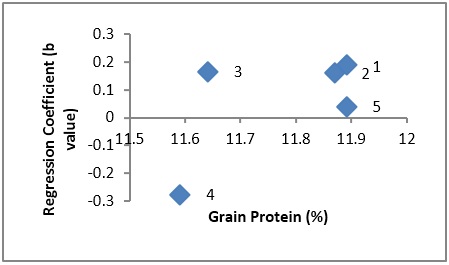
Fig.: Scatter plot showing relationship of cultivars adaptation(Regression Coefficient) and grain protein percentage in rice

Fig.: Scatter plot showing relationship of cultivars adaptation (Regression Coefficient) and grain yield in rice

Fig.: Scatter plot showing relationship of cultivars adaptation (Regression Coefficient) and total chlorophyll content
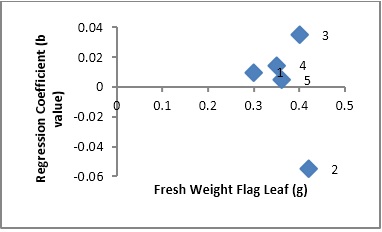
Fig.: Scatter plot showing relationship of cultivars adaptation (Regression Coefficient) and fresh weight flag leaf in rice
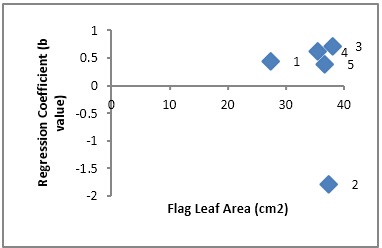
Fig.: Scatter plot showing relationship of cultivars adaptation (Regression Coefficient) and flag leaf area in rice
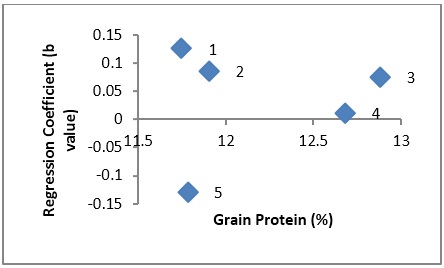
Fig.: Scatter plot showing relationship of cultivars adaptation Regression Coefficient) and grain protein percentage in wheat
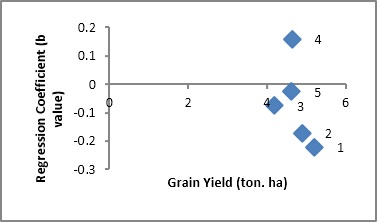
Fig.: Scatter plot showing relationship of cultivars adaptation (Regression Coefficient) and grain yield in wheat
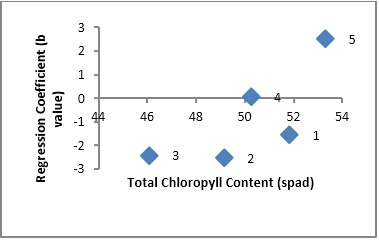
Fig.: Scatter plot showing relationship of cultivars adaptation (Regression Coefficient) and total chlorophyll content in wheat
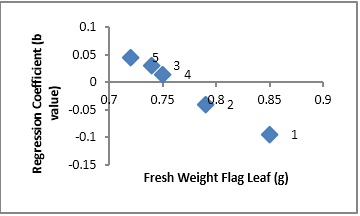
Fig.: Scatter plot showing relationship of cultivars adaptation (Regression Coefficient) and fresh weight flag leaf in wheat
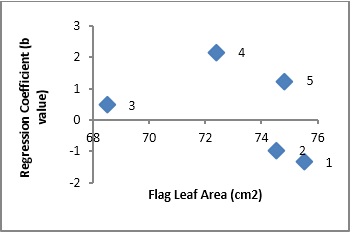
Fig.: Scatter plot showing relationship of cultivars adaptation (Regression Coefficient) and flag leaf area in wheat
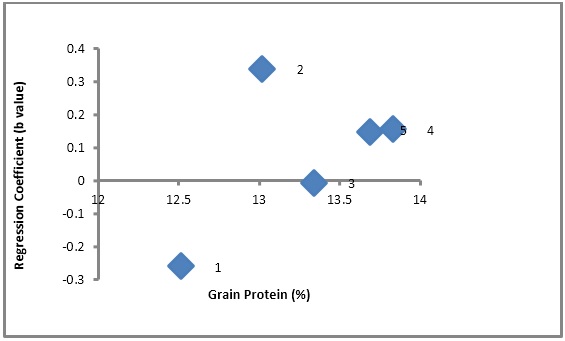
Fig.: Scatter plot showing relationship of cultivars adaptation (Regression Coefficient) and grain protein percentage in oat
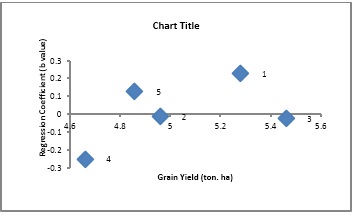
Fig.: Scatter plot showing relationship of cultivars adaptation (Regression Coefficient) and grain yield in oat
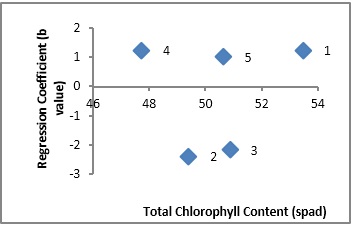
Fig.: Scatter plot showing relationship of cultivars adaptation (Regression Coefficient) and total chlorophyll content in oat
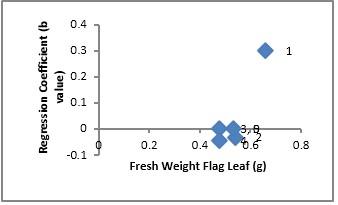
Fig.: Scatter plot showing relationship of cultivars adaptation (Regression Coefficient) and fresh weight flag leaf in oat
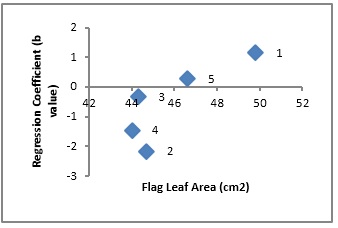
Fig.: Scatter plot showing relationship of cultivars adaptation (Regression Coefficient) and flag leaf area in oat
Related Journal Subscription
Important Publications Links

Journal of Medicinal Plants Studies

- Home
- About Us
- Editorial Board
- Archives
- Instructions
- Article Submission
- Publish Book (ISBN)
- Contact Us
- Helpline No.: +91-9711224068
- Fast Publication: +91-7048922346